"Empowering food analysts and laboratory professionals with expert insights, ISO 17025 resources, regulatory updates, industry testing requirements, training, and career opportunities for excellence in food testing."
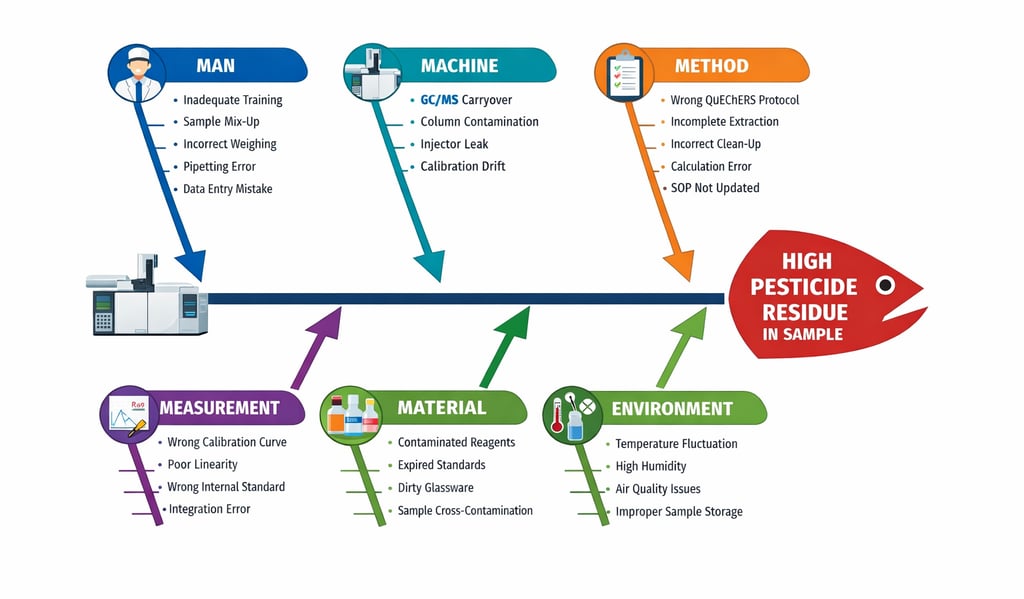
Fish Bone Diagram (4M Method): Identifying the Primary Potential Causes of a Problem
The article explains what a Fish Bone (Ishikawa) Diagram is and how it is used for root cause analysis in food testing laboratories. It analyzes every stage—from sample receiving, preparation, extraction, and instrumental analysis to calibration and raw data entry—using the 4M framework (Man, Method, Machine, Material). The article emphasizes systematic investigation, evidence-based root cause identification, and the importance of structured analysis for ISO/IEC 17025 and NABL compliance, as well as effective CAPA implementation.
2/19/20264 min read
In quality management, food testing laboratories, manufacturing industries, and service sectors, identifying the root cause of a problem is critical. One of the most powerful and visual tools used for this purpose is the Fish Bone Diagram, also known as the Ishikawa Diagram or Cause-and-Effect Diagram.
Developed by Japanese quality control expert Kaoru Ishikawa in the 1960s, this diagram helps teams systematically analyze possible causes of a specific problem. It is widely used in quality management systems, including ISO standards, laboratory investigations, CAPA (Corrective and Preventive Action), and food safety audits.
We will understand:
· What is a Fish Bone Diagram?
· What is the 4M Method?
· How to identify the primary potential cause of a problem
· A practical example
· A human-text diagram illustration
What is a Fish Bone Diagram?
A Fish Bone Diagram is a visual tool used to explore all possible causes of a specific problem. It is called a "fish bone" because its structure resembles the skeleton of a fish:
· The head represents the problem.
· The bones represent categories of causes.
· The smaller bones represent detailed potential causes.
It is also known as the Cause-and-Effect Diagram because it links causes to a specific effect (problem).
The 4M Method in Fish Bone Diagram
In laboratory testing, and quality systems, the most commonly used cause categories are called the 4Ms:
Man (Personnel)
Method
Machine
Material
These four categories help ensure that no major area is overlooked while investigating a problem.
1. Man (People)
This category includes all human-related factors that may contribute to the problem.
Examples:
· Lack of training
· Inadequate supervision
· Human error
· Improper skill level
· Non-compliance with SOP
· Misinterpretation of instructions
In laboratories, common “Man” causes may include:
· Incorrect sample preparation
· Calculation errors
· Improper documentation
· Failure to follow testing protocol
Human factors are often the first suspected cause, but systematic analysis is essential before concluding.
2. Method
This refers to procedures, processes, or systems used to perform the work.
Examples:
· Incomplete or outdated SOP
· Incorrect test method
· Inadequate environmental condition
· Inadequate validation
· No defined acceptance criteria
· Improper sampling procedure
In a food testing laboratory, method-related issues could include:
· Non-validated method
· Incorrect sample extraction technique
· Improper incubation time
· Deviations not recorded
Method-related problems are common when procedures are not standardized or regularly reviewed.
3. Machine
Machine refers to equipment, instruments, tools, and technology used in the process.
Examples:
· Equipment malfunction
· Calibration/Intermediate checks issues
· Instrument breakdown
· Improper maintenance
· Software errors
· Temperature control failure
Machine issues are particularly critical in accredited laboratories where equipment reliability directly affects result accuracy.
4. Material
Material includes consumables, reagents, samples, Certified Reference Material and other physical inputs.
Examples:
· Poor quality raw materials
· Expired reagents /Certified Reference Material
· Contaminated samples
· Improper storage conditions
· Batch variability
Material-related causes are often overlooked but can significantly impact results.
Example:-
Problem: Unexpected high pesticide residue detected in a routine vegetable sample.
Analyze all stages — from sample receiving to raw data entry — and identify potential causes.
Problem Statement (Effect)
Unexpected high pesticide residue result (e.g., Chlorpyrifos above MRL) in vegetable sample
Process Flow in Pesticide Residue Testing
Before building the fish bone, let us outline the typical workflow in a food testing laboratory:
· Sample Receiving
· Sample Coding & Storage
· Sample Preparation (Homogenization)
· Extraction (e.g., QuEChERS method)
· Clean-up (d-SPE)
· Instrumental Analysis (GC-MS/MS or LC-MS/MS)
· Calibration & Quantification
· Data Processing
· Raw Data Entry in Raw Data Sheet
· Result Review & Reporting
Now analyze each stage using a complex Fish Bone Diagram.
Stage-wise Elaboration of Potential Causes
Examine each stage from sample receiving to raw data entry.
1. Sample Receiving
This is the first and critical control point.
Possible Causes:
· Sample not properly sealed
· Cross-contamination during receipt
· Wrong labeling
· Incorrect documentation in LIMS
· Delayed storage
If a vegetable sample contaminated externally during transportation is not documented, results may appear falsely high.
2. Sample Coding & Storage
Proper coding and storage (usually 2–8°C or frozen depending on matrix) are essential.
Potential Issues:
· Sample mix-up during coding
· Wrong storage temperature
· Prolonged exposure at room temperature
· Storage near contaminated samples
If stored improperly, degradation products may form, leading to analytical interference.
3. Sample Preparation (Homogenization)
Pesticide residues are often unevenly distributed.
Man-related Causes:
· Improper homogenization
· Inadequate mixing
· Equipment not cleaned between samples
Machine-related Causes:
· Grinder contamination
· Residue from previous high-level sample
Cross contamination during homogenization is a common root cause.
4. Extraction Stage (e.g., QuEChERS Method)
Extraction efficiency directly affects result accuracy.
Method Issues:
· Incorrect salt composition
· Wrong solvent volume
· Incomplete shaking time
· Deviated centrifugation speed
Man Issues:
Incorrect sample weight
Wrong solvent pipetted
Under-extraction may cause low results, while contamination during extraction may cause high results.
5. Clean-up Stage (d-SPE)
Improper clean-up can cause matrix interference.
Material Issues:
Expired PSA or MgSO₄
Contaminated clean-up tubes
Method Issues:
Inadequate vortexing
Insufficient centrifugation
Matrix enhancement can artificially increase pesticide peak area.
6. Instrumental Analysis (GC-MS/MS or LC-MS/MS)
Most critical analytical stage.
Machine Causes:
· Carry-over from previous injection
· Dirty injector liner
· Column bleed
· Contaminated ion source
· Improper tuning
Carry-over is a frequent cause of false high results.
7. Calibration & Quantification
Quantification errors often lead to incorrect high values.
Measurement Causes:
· Incorrect calibration standard preparation
· Expired CRM
· Poor calibration linearity
· Wrong dilution factor
· Incorrect internal standard concentration
If standard concentration is lower than actual, sample appears artificially high.
8. Data Processing
Chromatographic integration plays a crucial role.
Measurement Errors:
· Manual integration error
· Peak misidentification
· Noise interpreted as analyte peak
· Incorrect retention time match
Improper integration can significantly inflate results.
9. Raw Data Entry in Raw Data Sheet
This stage is often underestimated.
Man-related Causes:
· Typographical error
· Decimal misplacement
· Unit conversion mistake (ppm vs mg/kg)
· Wrong sample code entry
· Formula error in Excel sheet
Example:
Actual value: 0.08 µg/kg
Entered value: 0.08 mg/kg
This creates regulatory non-compliance.
Identifying the Primary Potential Cause
To identify the primary cause:
· Check blank sample
· Review QC results
· Examine recovery data
· Verify calibration curve
· Check instrument logbook
· Review analyst worksheet
· Reprocess chromatogram
· Re-analyze retained sample
Example scenario:
· Blank shows contamination.
· Previous sample had very high chlorpyrifos level.
· Injector liner was not cleaned.
Primary Potential Cause: Carry-over contamination in GC-MS injector (Machine category).
© 2025. All rights reserved. All content on this website is the intellectual property of The Food Analyst. Unauthorized use or reproduction is prohibited.
Contact Us
The Food Analyst Team
We are available in multiple locations:
Bangalore | Delhi | Mumbai
Email for editorial: contact@foodanalyst.in
For advertisement: inquiryfoodanalyst@gmail.com